Topics in Part 6
- Creating a Statistics Chart to display birthday distribution.
Birthday Statistics
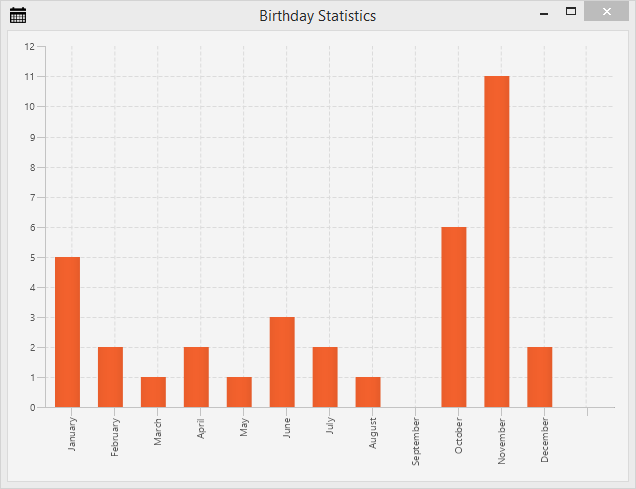
All our people in the AddressApp have a birthday. Wouldn’t it be nice to have some statistics about when our people celebrate their birthday.
We’ll use a Bar Chart containing a bar for each month. Each bar shows how many people have their birthday in that particular month.
The Statistics FXML View
-
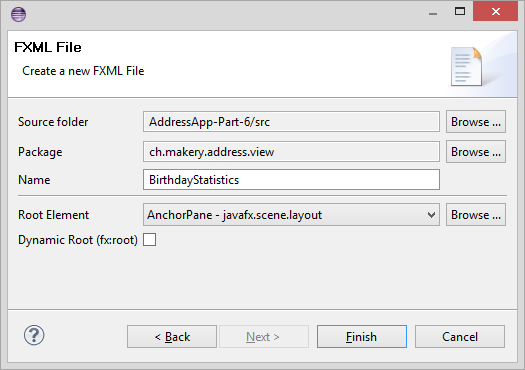
We start by creating a
BirthdayStatistics.fxmlfile inside ourch.makery.address.viewpackage (Right-click on package | New | other… | New FXML Document).
-
Open the
BirthdayStatistics.fxmlfile in Scene Builder. -
Select the root
AnchorPane. In the Layout group set the Pref Width to 620 and the Pref Height to 450. -
Add a
BarChartto theAnchorPane. -
Right-click on the
BarChartand select Fit to Parent. -
Save the fxml file, go to Eclipse and refresh the project.
Before we’ll come back to Scene Builder we’ll first create the controller and wire everything up in our MainApp.
The Statistics Controller
In the view package ch.makery.address.view create a Java class called BirthdayStatisticsController.java.
Let’s first take a look at the entire controller class before I start explaining:
BirthdayStatisticsController.java
package ch.makery.address.view;

import java.text.DateFormatSymbols;
import java.util.Arrays;
import java.util.List;
import java.util.Locale;

import javafx.collections.FXCollections;
import javafx.collections.ObservableList;
import javafx.fxml.FXML;
import javafx.scene.chart.BarChart;
import javafx.scene.chart.CategoryAxis;
import javafx.scene.chart.XYChart;
import ch.makery.address.model.Person;

/**
 * The controller for the birthday statistics view.
 *
 * @author Marco Jakob
 */
public class BirthdayStatisticsController {

    @FXML
    private BarChart<String, Integer> barChart;

    @FXML
    private CategoryAxis xAxis;

    private ObservableList<String> monthNames = FXCollections.observableArrayList();

    /**
     * Initializes the controller class. This method is automatically called
     * after the fxml file has been loaded.
     */
    @FXML
    private void initialize() {
        // Get an array with the English month names.
        String[] months = DateFormatSymbols.getInstance(Locale.ENGLISH).getMonths();
        // Convert it to a list and add it to our ObservableList of months.
        monthNames.addAll(Arrays.asList(months));

        // Assign the month names as categories for the horizontal axis.
        xAxis.setCategories(monthNames);
    }

    /**
     * Sets the persons to show the statistics for.
     *
     * @param persons
     */
    public void setPersonData(List<Person> persons) {
    	// Count the number of people having their birthday in a specific month.
        int[] monthCounter = new int[12];
        for (Person p : persons) {
            int month = p.getBirthday().getMonthValue() - 1;
            monthCounter[month]++;
        }

        XYChart.Series<String, Integer> series = new XYChart.Series<>();

        // Create a XYChart.Data object for each month. Add it to the series.
        for (int i = 0; i < monthCounter.length; i++) {
        	series.getData().add(new XYChart.Data<>(monthNames.get(i), monthCounter[i]));
        }

        barChart.getData().add(series);
    }
}
How the Controller Works
-
The controller will need access to two elements from our FXML file:
- The
barChart: It has the typeStringandInteger. TheStringis used for the month on the x-axis and theIntegeris used for the number of people in a specific month. - The
xAxis: We’ll use this to add the month Strings.
- The
-
The
initialize()method fills the x-axis with a list of all the months. -
The
setPersonData(...)method will be accessed by theMainAppclass to set the person data. It loops through all persons and counts the birthdays per month. Then it addsXYChart.Datafor every month to the data series. EachXYChart.Dataobject will represent one bar in the chart.
Connecting View and Controller
-
Open
BirthdayStatistics.fxmlin Scene Builder. -
In the Controller group set
BirthdayStatisticsControlleras controller. -
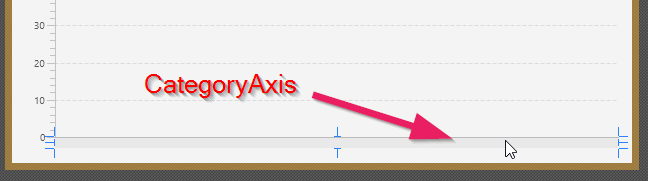
Select the
BarChartand choosebarChartas fx:id Property (in the Code group). -
Select the
CategoryAxisand choosexAxisas fx:id Property.
-
You may add a title to the
BarChart(in Properties group) for further styling.
Connecting the View/Controller with MainApp
We’ll use the same mechanism for our birthday statistics that we used for the edit person dialog, a simple popup dialog.
Add the following method to your MainApp class:
/**
 * Opens a dialog to show birthday statistics.
 */
public void showBirthdayStatistics() {
    try {
        // Load the fxml file and create a new stage for the popup.
        FXMLLoader loader = new FXMLLoader();
        loader.setLocation(MainApp.class.getResource("view/BirthdayStatistics.fxml"));
        AnchorPane page = (AnchorPane) loader.load();
        Stage dialogStage = new Stage();
        dialogStage.setTitle("Birthday Statistics");
        dialogStage.initModality(Modality.WINDOW_MODAL);
        dialogStage.initOwner(primaryStage);
        Scene scene = new Scene(page);
        dialogStage.setScene(scene);

        // Set the persons into the controller.
        BirthdayStatisticsController controller = loader.getController();
        controller.setPersonData(personData);

        dialogStage.show();

    } catch (IOException e) {
        e.printStackTrace();
    }
}
Everything is set up, but we don’t have anything that actually calls the new showBirthdayStatistics() method. Luckily we already have a menu in RootLayout.fxml that can be used for this purpose.
Show Birthday Statistics Menu
In your RootLayoutController add the following method which will handle user clicks on the show birthday statistics menu item:
/**
 * Opens the birthday statistics.
 */
@FXML
private void handleShowBirthdayStatistics() {
  mainApp.showBirthdayStatistics();
}
Now, open the RootLayout.fxml file with Scene Builder. Create the Statistics Menu with a Show Statistics MenuItem:
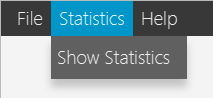
Select the Show Statistics MenuItem and choose handleShowBirthdayStatistics for On Action (in Code group)
Go to Eclipse, refresh the project and test it.
More Information on JavaFX Charts
A good place for more information is the official Oracle tutorial on Working with JavaFX Charts.
What’s Next?
In the last tutorial Part 7 we will finally deploy our application (i.e. package and deliver the app to our users).